Just to wrap up this look at Tableau and Power BI, the final blog in the series will provide some additional thoughts to take into consideration when selecting a Data Visualisation tool.
If you are just looking to use this as an individual my strongest suggestion would be to just download the free versions and try them.
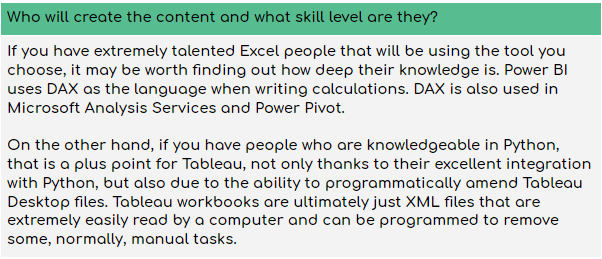
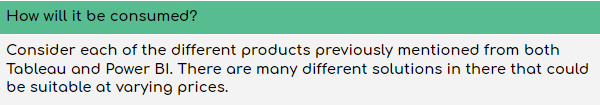
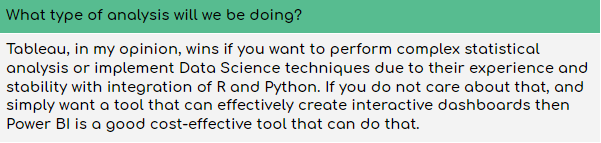
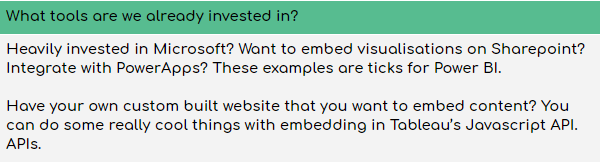
If your interest spreads beyond individual use, then start by asking these questions:
Prerequisites to performing Data Visualisation correctly
Data Visualisation tools like Tableau and Power BI have changed the world in terms of how companies use and make decisions based upon their data. With powerful tools like these it gets very easy to unintentionally or intentionally mislead. This could be through poor visualisation choice or through not correctly testing your outputs meaning the analysis / information shared is wrong.
Make sure everyone creating content is well trained in what visualisation best practice is. There are plenty of resources online, but a good starting point is Stephen Few, and his blog at https://www.perceptualedge.com/. He has a series of books called “Show me the numbers” which are great in getting you thinking about why, maybe, some visualisations are not the best ones to use.
Training in the visualisation tool itself is obvious, but how people are trained is important. Companies like Power BI and Tableau have excellent resources online to help with training. The best way to learn is to actually build content. To take training to another level try downloading content published by the community and see how they are put together.
With training it is important to focus on performance to make sure you know how to build content in the most efficient and performant way. These tools can handle huge datasets but only if the visualisations are built correctly, and you are not forcing the tool to do something it is not designed to do. Knowing the tools limitations is important.
The most important thing to enabling a successful implementation of a data visualisation tool is the data structure. Even though the market leaders allow you to transform your data in many ways and connect to many disparate sources, this will only get you so far. Having a well defined, productionised data source will ensure that you get the insights you need and that your data is accurate. Getting this right is the most important aspect of Business Intelligence and effective analysis.